At some point during the development of a game, you need to be able to show information that helps you debug issues in your game. What kind of information? That really depends on your game and what your needs are. It could be as simple as printing some text that shows the result of an internal calculation, or it could be as fancy as a chart showing the ratio of decisions being made by the game’s artificial intelligence.
There are different kinds of debugging needed as well. Sometimes, you need something temporary to help you figure out why that function you just wrote isn’t behaving the way you expect it to. Other times, you want an “official” debugging instrument that lives on as a permanent display in your game’s debugging interface.
How does one go about building a debugging system, however? In this blog tutorial, we’ll build a debugging system in the Godot game engine, one that is flexible, yet powerful. It’s useful both for temporary debugging and a long-term debugging solution. I use this system to provide a debugging interface for my own games, and I want to share how to make one like it in the hopes that it helps you in your own game development efforts.
This will be a multiple-part series. At the end of it, you’ll have the root implementation of the debugging system, and knowledge on how to extend it to suit your debugging purposes.
If you want to see the end result, you can download the sample project from Github: https://github.com/Jantho1990/Sample-Project-Debug-Interface
Existing Debugging Tools in Godot
Godot comes with a number of functionalities that are useful for debugging. The most obvious of these is the trusty print() function. Feed it a string, and that string will get printed out to the debugging console during game runtime. Even when you have a debugging system in place, print() is still useful as part of your toolset for temporary debugging solutions. That said, nothing you show with print() is exposed to an in-game interface, so it’s not very useful if you want to show debugging information on a more permanent basis. Also, if you need to see information that updates on every frame step, the debugging console will quickly be overwhelmed with a flood of printed messages, to the point where Godot will bark at you about printing too many messages. Thus, while print() definitely has its uses, we are still in need of something more robust for long-term debugging solutions.
One way I solved this problem in the past is by creating a DebugLabel node, based on a simple Label. This node would listen for a signal, and when said signal was received it would set its text value to whatever string was sent to it. The code looked something like this:
# DebugLabel
extends Label
export(String) var debug_name = "DebugLabel1"

func _ready() -> void:
  GlobalMessenger.listen(debug_name, self, "on_Debug_message_received")

func _on_Debug_message_received(data):
  text = str(data)
This solution also depended on a separate
GlobalMessengersystem that functions as a global way of passing information. But that system is a tale for another day.
This gave me a solution for printing debugging information that updated on every process step, without overloading the debugging console. While this little component was useful, it had its drawbacks. Every call to print a message to the DebugLabel would overwrite the previous value, so if I needed to show more than one piece of updating information, I would have to create multiple DebugLabel nodes. It wouldn’t take long for my scenes to be cluttered with DebugLabel nodes. Also, this still wasn’t part of a debugging system. If there was a DebugLabel, it’d show, regardless of whether you needed to view debugging information or not. Thus, while this node also served a valuable purpose, it was not enough for a proper debugging solution.
So what does a debugging solution need? It needs a way to conditionally show and hide debugging information, depending on whether such information needs to be viewed. It also needs to expose a method for game code to interact with it to pass in debugging information. There are many possible kinds of information that we’d want to see, so this interaction method must support being able to accept multiple kinds of information. Finally, there should be an easy way of creating debugging scenes to organize the information in whatever ways make sense to those that view the debugging information.
With that high-level information, let’s start by tackling the first part of that paragraph: conditionally showing and hiding the debugging information.
Creating a Test Scene
But before we start working on the debugging system proper, we should have a test scene that exists to help us test that what we’re creating actually works. It doesn’t need to be anything fancy.
While this part of the tutorial is optional, the tutorial series will be assuming the existence of this test scene. If you choose not to make it, then you’ll have to figure out how to test the debugging system’s code in a different way.
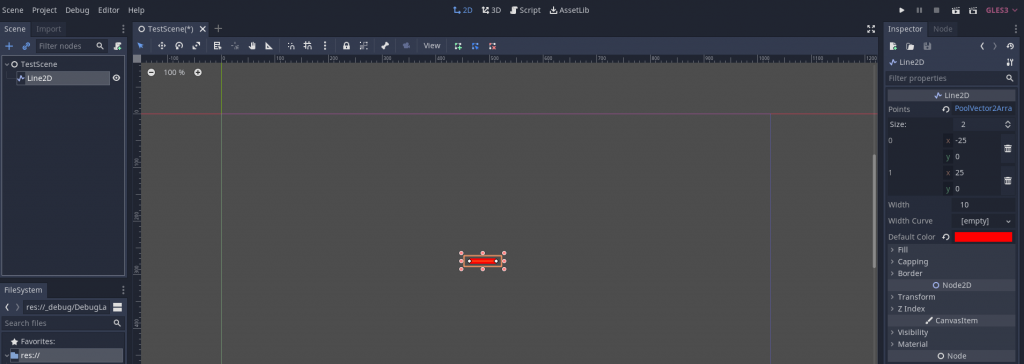
Create a scene, and have it extend Node. Let’s call it “TestScene”. In TestScene, add a Line2D node, make it whatever color you want (I chose red), and set the points to make it some easily-visible size (I set mine to [-25, 0], [25, 0] to make a 50px-long horizontal line). Move the Line2D somewhere near the center of the scene; it doesn’t have to be exact, as long as it isn’t too close to the top or edge of the game window. Finally, click the triangle button to run Godot’s main scene; since we don’t have one defined, Godot will pop up an interface that will allow you to make TestScene the default scene, which you should do.
You can alternatively just run this individual scene without making it the main scene; I have chosen to make it the main scene in this tutorial purely out of convenience.
This is what my version of the test scene looks like after doing these things:
Now that we have a test scene, let’s get to building the debugging system proper.
Creating the DebugLayer Global
We need a way to interact with the debugging interface from anywhere in our game code. The most effective way to do this is to create a global scene that it loaded as part of the AutoLoads. This way, any time our game or a scene in our game is run, the debugging system will always be available.
Start by creating a new scene, called DebugLayer, and have it extend the CanvasLayer node. Once the scene is created, go to the CanvasLayer node properties and set the layer property to 128.
That
layerproperty tells Godot what order it should renderCanvasLayernodes in. The highest value allowed for that property is128, and since we want debugging information to be rendered atop all other information, that’s what we’ll set ourDebugLayerto.For more information on how
CanvasLayerworks, you can read this documentation page.
Now, create a script for our node, DebugLayer.gd. For now, we’re not going to add anything to it, we just want the script to be created. Make sure it, as well as the DebugLayer scene, are saved to the directory _debug (which doesn’t exist yet, so you’ll need to create it).
Finally, go to Project -> Project Settings -> AutoLoad, and add the DebugLayer scene (not the DebugLayer.gd script) as an AutoLoad, shortening its name to Debug in the process. This is how we’ll make our debugging interface accessible from all parts of our game.
Yes, you can add scenes to AutoLoad, not just scripts. I actually discovered that thanks to a GDQuest tutorial on their Quest system, and have since used that pattern for a wide variety of purposes, including my debugging system.
To verify that our DebugLayer shows in our game, add a Label child to the DebugLayer scene, then run the game. You should be able to see that Label when you run the game, proving that DebugLayer is being rendered over our TestScene.
Toggle Debug Visibility
This isn’t particularly useful yet, though. We want to control when we show the debugging information. A good way to do this is to designate a key (or combination of keys) that, when pressed, toggles the visibility of DebugLayer and any nodes it contains.
Open up the project settings again, and go to Input Map. In the textbox beside Action:, type “toggle_debug_interface” and press the Add button. Scrolling down to the bottom of the Input Map list will reveal our newly-added action at the bottom.
Now we need to assign some kind of input that will dispatch this toggle_debug_interface action. Clicking the + button will allow you to do this. For this tutorial, I’ve chosen to use Shift + ` as the combination of keys to press (Godot will show ` as QuoteLeft). Once this is done, go ahead and close the project settings window.
It’s time to start adding some code. Let’s go to DebugLayer.gd and add this code:
var show_debug_interface = false


func _ready():
  _set_ui_container_visibility(show_debug_interface)


func _set_ui_container_visibility(boolean):
  visible = boolean
Right away, the editor will show an error on the visible = boolean line. You can confirm the error is valid by running the project and seeing the game crash on that line, with the error The identifier "visible" isn't declared in the current scope. That’s because CanvasLayer doesn’t inherit from the CanvasItem node, so it doesn’t contain a visible property. Therefore, we’ll need to add a node based on Control that acts as a UI container, and it is this node that we’ll toggle visibility for.
CanvasItemis the node all 2D and Control (aka UI) nodes inherit from.
Add a MarginContainer node to DebugLayer, calling it DebugUIContainer. Then, move the test label we created earlier to be a child of the DebugUIContainer. Finally, in DebugLayer.gd, change the visibility target to our new UI container:
onready var _uiContainer = $DebugUIContainer


func _set_ui_container_visibility(boolean):
  _uiContainer.visible = boolean
You may notice that I’m prefixing
_uiContainerwith an underscore. This is a generally-accepted Godot best practice for identifying class members that are intended to be private, and thus should not be accessed by code outside of that class. I also use camelCase to indicate that this particular variable represents a node. Both are my personal preferences, based on other best practices I’ve observed, and you do not need to adhere to this style of nomenclature for the code to work.
At this point, if you run the test scene, the test label that we’ve added should no longer be visible (because we’ve defaulted visibility to false). That’s only half the battle, of course; we still need to add the actual visibility toggling functionality. Let’s do so now:
func _input(_event):
  if Input.is_action_just_pressed('toggle_debug_interface'):
    show_debug_interface = !show_debug_interface
    _set_ui_container_visibility(show_debug_interface)
_input() is a function Godot runs whenever it detects an input action being dispatched. We’re using it to check if the input action is our toggle_debug_interface action (run in response to our debug key combination we defined earlier). If it is our toggle_debug_interface action, then we invert the value of show_debug_interface and call _set_ui_container_visibility with the new value.
Technically, we could just call the visibility function with the inverted value, but setting a variable exposes to outside code when the debug interface is being shown. While this tutorial is not going to show external code making use of that, it seems a useful enough functionality that we’re going to include it nonetheless.
Run the test scene again, and press Shift + `. This should now reveal our test label within DebugLayer, and prove that we can toggle the debug interface’s visibility. If that’s what happens, congratulations! If not, review the tutorial to try and identify what your implementation did incorrectly.
Congratulations!
We now have the basics of a debugging interface. Namely, we have a DebugLayer scene that will house our debugging information, one that we can make visible or invisible at the press of a couple of keys.
That said, we still don’t have a way of actually adding debugging information. As outlined earlier, we want to be able to implement debugging displays that we can easily reuse, with a simple API for our game code to send debugging information to the debugging system.
To accomplish these objectives, we’ll create something that I call “debug widgets”. How does a debug widget work? Find out in the next part of this tutorial!
You can review the end state of Part 1 in the Github repo by checking out the tutorial-part-1 branch.
No Comments